Image
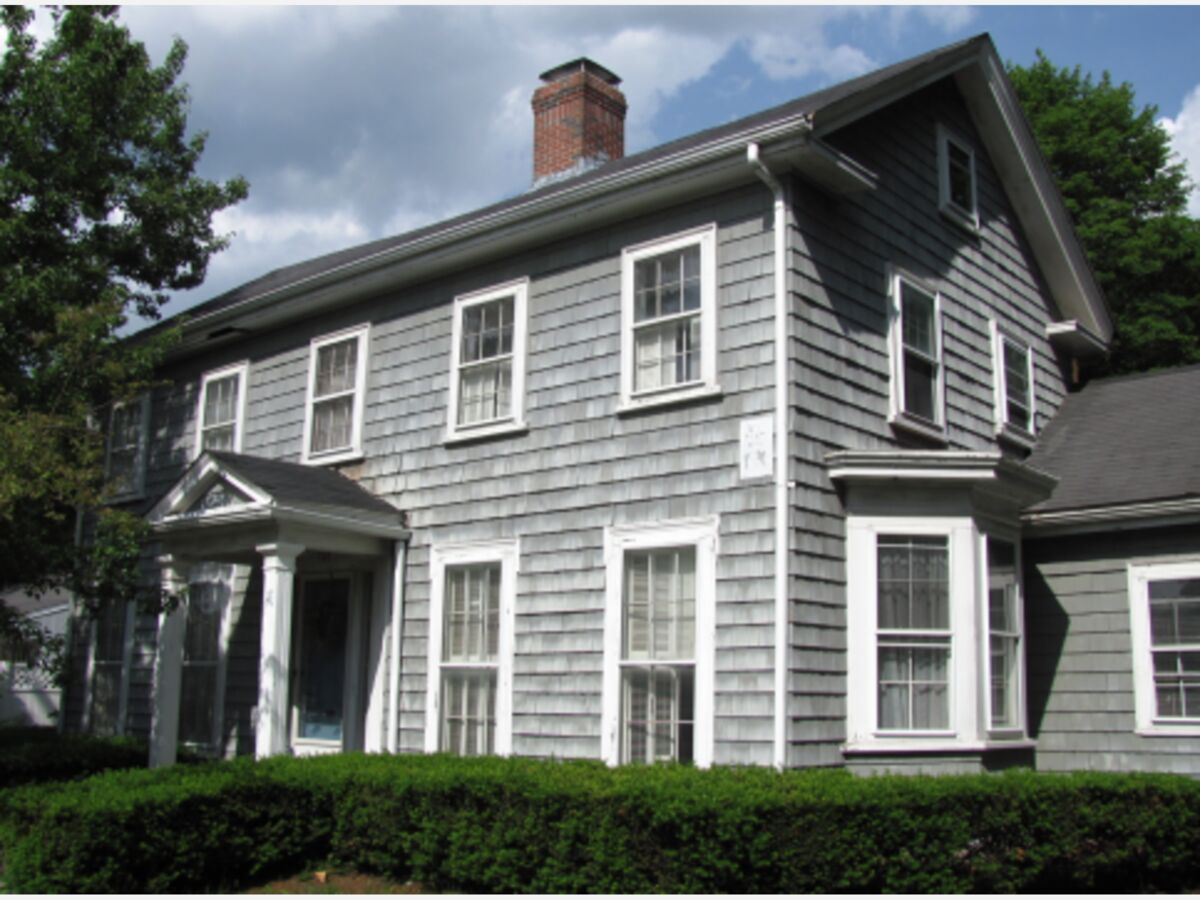
Image of a Westwood house by John Phelan from Wikimedia Commons
By Stacker
Buying a home is an investment and an increasingly expensive one. The typical value of a home in the United States today is $316,368, a 19.3% increase over the last year.
Stacker compiled a list of cities with the most expensive homes in Boston-Cambridge-Newton, MA metro area using data from Zillow. Cities are ranked by the Zillow Home Values Index for all homes as of January 2022. Cities with at least three years of historical data were included. The charts in this story were created automatically using Matplotlib.
Home buyers have a lot to consider when house-hunting or looking to invest in rental properties, from the state of the housing market itself to taxes and potential resale value. The housing market grew robust and pricey in the decade following the 2008 recession, and more recently saw a boom during the coronavirus pandemic. Another consideration is the house itself, including what kind of upkeep it requires and those associated costs. Depreciation affects all homes at an average rate of 3.636% each year, which can be a help come tax season if you use your home for business or rentals but may cost you later in capital gains taxes when you sell. Meanwhile, land value tends to increase over time depending on several factors including where the house is located and what amenities and homes are nearby. More desirable neighborhoods allow sellers to charge more; the mantra "location, location, location" has never been more relevant.
How does your city rank? See the cities with most expensive houses in Boston-Cambridge-Newton, MA metro below:
You may also like: Zip codes with the most expensive rent in Boston
- Typical home value: $957,614
- 1 year price change: +18.3%
- 5 year price change: +33.2%
- Typical home value: $974,626
- 1 year price change: +14.0%
- 5 year price change: +35.5%
- Typical home value: $1,019,249
- 1 year price change: +13.8%
- 5 year price change: +31.4%
- Typical home value: $1,055,635
- 1 year price change: +18.3%
- 5 year price change: +41.7%
- Typical home value: $1,080,357
- 1 year price change: +17.9%
- 5 year price change: +35.6%
You may also like: Dogs available for adoption in Boston
- Typical home value: $1,119,404
- 1 year price change: +24.5%
- 5 year price change: +36.1%
- Typical home value: $1,124,101
- 1 year price change: +19.9%
- 5 year price change: +40.6%
- Typical home value: $1,143,781
- 1 year price change: +14.7%
- 5 year price change: +32.7%
- Typical home value: $1,162,799
- 1 year price change: +17.3%
- 5 year price change: +33.1%
- Typical home value: $1,203,346
- 1 year price change: +6.4%
- 5 year price change: +25.7%
You may also like: Highest-paying jobs in Boston
- Typical home value: $1,277,815
- 1 year price change: +11.4%
- 5 year price change: +29.2%
- Typical home value: $1,303,122
- 1 year price change: +15.0%
- 5 year price change: +31.2%
- Typical home value: $1,311,929
- 1 year price change: +13.5%
- 5 year price change: +32.7%
- Typical home value: $1,317,143
- 1 year price change: +12.4%
- 5 year price change: +41.7%
- Typical home value: $1,321,655
- 1 year price change: +9.8%
- 5 year price change: +30.5%
You may also like: Highest-rated things to do in Boston, according to Tripadvisor
- Typical home value: $1,361,431
- 1 year price change: +15.2%
- 5 year price change: +33.4%
- Typical home value: $1,452,541
- 1 year price change: +14.7%
- 5 year price change: +27.6%
- Typical home value: $1,643,010
- 1 year price change: +11.8%
- 5 year price change: +25.3%
- Typical home value: $1,796,714
- 1 year price change: +19.1%
- 5 year price change: +58.4%
- Typical home value: $1,865,214
- 1 year price change: +14.8%
- 5 year price change: +22.0%
You may also like: Highest-rated fine dining restaurants in Boston, according to Tripadvisor
This article has been re-published pursuant to a CC BY-NC 4.0 License. The original article from Stacker is available here.


Patchy rain nearby, with a high of 83 and low of 69 degrees. Patchy light rain in the morning, patchy rain nearby in the afternoon, clear in the evening, mist overnight.


We used to spray our lawn with a company that said they used non-toxic chemicals. The loss of bees, frogs, pollinators and birds in our garden was dramatic.
Great topic! I'd love to see more from the environmental action committee on encouraging less use of pesticides/weed killers/fertilizers in town.
what a great way to encourage people to plant native, it gives me so much pleasure to see who is visiting my plants.